Automated valuation tooling for real-estate investors
Automated after-repair-value tool for real-estate investors. Nine-stage pipeline pulls live listing data, finds comps, reads property photos with a multimodal model, and estimates repair costs from live local pricing. No stale tables, no year-built shortcuts.
 NDA
NDAReal-estate flippers ask two questions before every purchase. Is the listed price fair given the neighborhood, and if I renovate it, what is it worth after repair? The industry answers with static per-square-foot tables and renovation sheets that were current three years ago. The flipper puts real money on a heuristic that is wrong half the time.
Static tables lose money
The naive approach is a spreadsheet. Pull a per-square-foot number from a table published last quarter, multiply by square footage, add a rehab budget guessed from the year built. The result reads like a valuation and behaves like a guess. Two houses on the same block, built the same year, can differ by $80K in renovation scope depending on what happened between the walls over three decades. Year-built does not know that.
The cost side is where the heuristic bites. A flipper overpays for a deal that never was because the sheet said the ARV would clear the numbers. Or passes on a good deal because the sheet said the rehab would eat the margin. Bad valuation, either direction, is money.
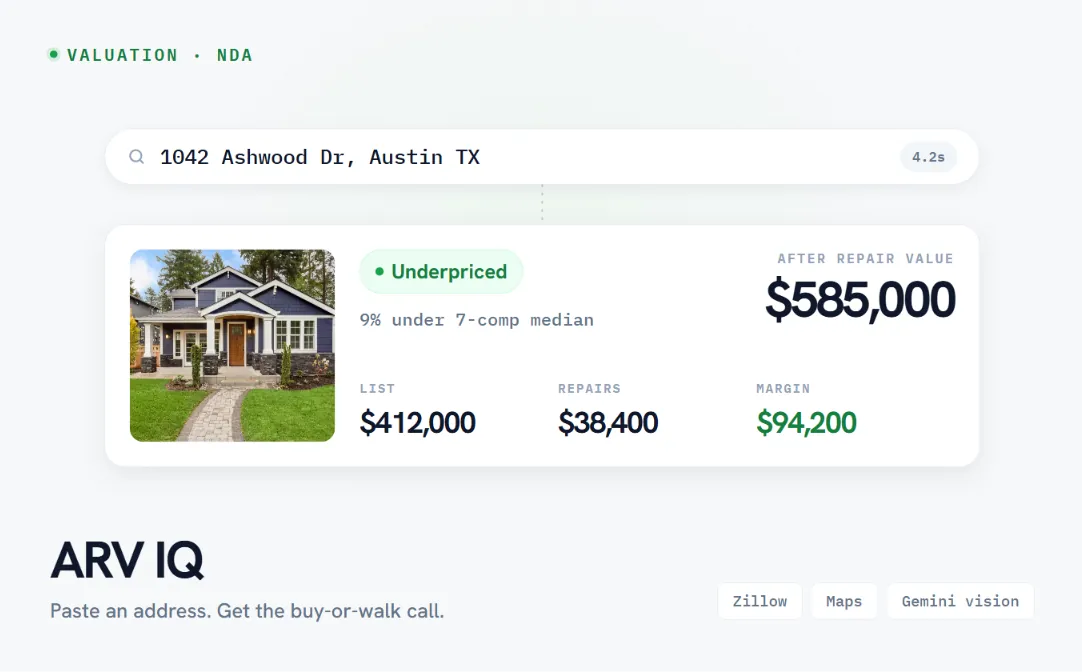
The client is a US real-estate investment platform. Their end users are house flippers who need three numbers in under a minute: what the property is actually worth today based on recent comps, what it is worth after repair, and whether the listed price is a deal, a wash, or a trap. The tool has to be defensible enough that a flipper will put real money behind its verdict without double-checking every line.
Nine stages, all live
User enters an address. Nine stages run in sequence before the report renders. Stage one pulls the subject property from Zillow live, not from a cache, with every field validated against a schema. Stage two runs a polygon-search query with Google Maps for comparable properties within a configurable radius, matched on beds, baths, and square-footage bands, and pulls each comp with its own live Zillow query. Stage three computes the comps-based market valuation as the median price-per-square-foot weighted by proximity and recency, with outlier detection stripping the foreclosure two doors down and the bidding-war house that closed 40% over ask.
Stage four is where the model earns its keep. Property photos from Zillow and Google Street View go to Gemini's multimodal endpoint. The model classifies each interior space and the exterior into condition tiers: move-in-ready, cosmetic-only, moderate-renovation, gut-renovation, structural-issues. Each tier maps to a defined scope of work. Photos tell the truth. Metadata guesses.
Stage five runs a web-search tool call for every renovation item the condition assessor flagged. Materials, labor rates, permit fees, disposal costs. Not a static price table. Real listings and quotes from local suppliers as of this week. Every line item carries its source URL. Stage six computes ARV against a comps set restricted to fully-renovated properties at the target finish level. Stage seven runs the deal math: expected profit at best-case ARV, worst-case ARV, expected time-to-flip from days-on-market, break-even, and margin-of-safety percentage.
Stage eight returns a verdict: overvalued, optimally priced, or underpriced, framed from the flipper's perspective. Underpriced deals get pushed up. Overpriced ones filter out before they waste any due-diligence time. Stage nine renders the full report as HTML, shareable via URL, with every price and every comp carrying its source URL and date.
A number a flipper trusts
The tool is live and in production. Real investors run it against real properties before real purchase decisions. The report answers all three questions in under a minute. If a lender or contractor questions any single line in the repair estimate, the user points at exactly where the number came from: a real listing, a real supplier quote, a real comp, a real date.
Every online repair-cost estimator I looked at guessed from year-built and square footage. That guess is wrong roughly half the time.
Every external service on the pipeline (Zillow, Google Maps, Gemini, web-search) is metered and cost-tracked per report. Rate limits are watched. The margin per report is a known number, not a hope. When any stage's data quality degrades (an unusually thin comps set, a photo batch the model cannot classify with confidence), the report surfaces the caveat instead of silently averaging over it.
The scattered spreadsheet-and-guess workflow it replaced does not need defending. Anyone who has flipped a house knows the difference between a real estimate and a static-table estimate. This is the real one, and it holds up under actual purchase decisions.
Anas